
I was helping one of our customers, who operates a vertical farm in Indiana, set up his reports in Agrilyst last week. I assumed he’d be most excited about the various yield graphs and insights. Instead, it was the zone capacity insights that peaked his interest. (Note: in Agrilyst, a zone is a physical location where plants are growing)
“This is what we need to ultimately measure sales better.”
This customer has a pretty neat operation. He’s built a vertical farm inside of a warehouse and has plenty of room to expand his systems. Before he does that though, he’s laser focused on getting everything right.
The biggest thing to get right is sales. And sales are driven by how the space in the farm is utilized. Of course, yield is important, but growers need to understand how crops are performing and how much space they occupy as well, because the two are interconnected.
What do I mean by this?
Let’s say I have 100 square feet of growing area and I want to grow Kale. If Kale has a yield of 5 lbs per square foot (note: these are made up numbers for example purposes only) and a growing rate of 30 days, then I should expect to harvest roughly 500 lbs of Kale every 30 days. That being said, most indoor farmers don’t plant and harvest a full facility all at once. They plant rotationally, so they can keep the facility full at all times and have harvests ready to go daily or weekly, year-round.
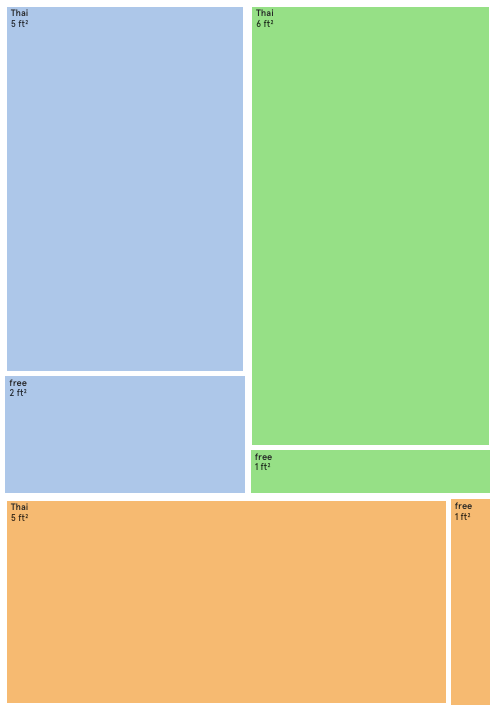
The production map in Agrilyst shows you your real-time space allocation.
So if we want to plant and harvest every day and keep the farm full at all times, I’ll plan on planting 3.33 sf of Kale every day. After a period of 30 days (the time it takes my Kale to grow), I’ll begin harvesting one batch of 3.33 square feet every day. I’ll then replace that space with more Kale and we’ll have a rotating cycle of delicious greens to sell every day.
Now if I can sell all of that Kale, at let’s say $7 per lb, I should be making $42,540 each year, at my yield of 5 lbs per square foot.
Let’s say I only plant 3 square feet of Kale every day instead, because getting to 3.33 is probably not super realistic, right? Well at 3 square feet each day, I’m only harvesting 15 lbs per day, which means I’m making $38,325 per year. In the end, I’m losing $4,215, or roughly 10% of my potential revenue, because of that 0.33 square feet.
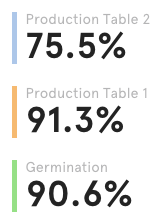
Space optimization correlates directly with top-level sales margins.
Now $4,000 may not seem like a lot of lost revenue, but what happens to farmers, like our customer in Indiana, who are operating much more than 100 square feet. At 10x, you’re losing $40,000. At 100x, you’re losing $400,000.
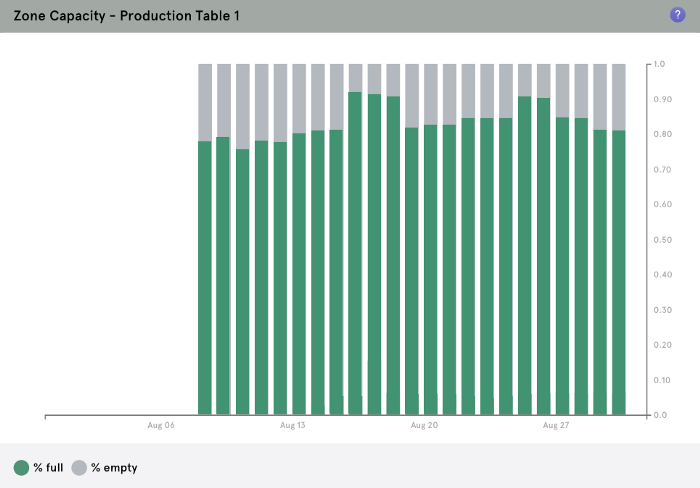
This is something I see all of the time with our growers. They’re operating at mostly full, but there’s always that little bit of space that sits empty. And it may not even be visible to us.
Production Map Key
Sometimes empty space is scheduled into production. If I’m operating a greenhouse, for example, during seasonal periods I may have to extend or shorten my growth cycle. And that means I’m going to have a period where there is scheduled empty space, or the opposite, for a whole growth cycle in order to adjust to the new growth times.
So it’s not super easy to spot good vs. bad empty space.
What I learned from our customer in Indiana is that it’s just as important to understand space allocations in your farm as it is to understand crop yields. Together, you can truly optimize for better margins.

Leave A Comment